Server Monitoring Dashboard UI Design

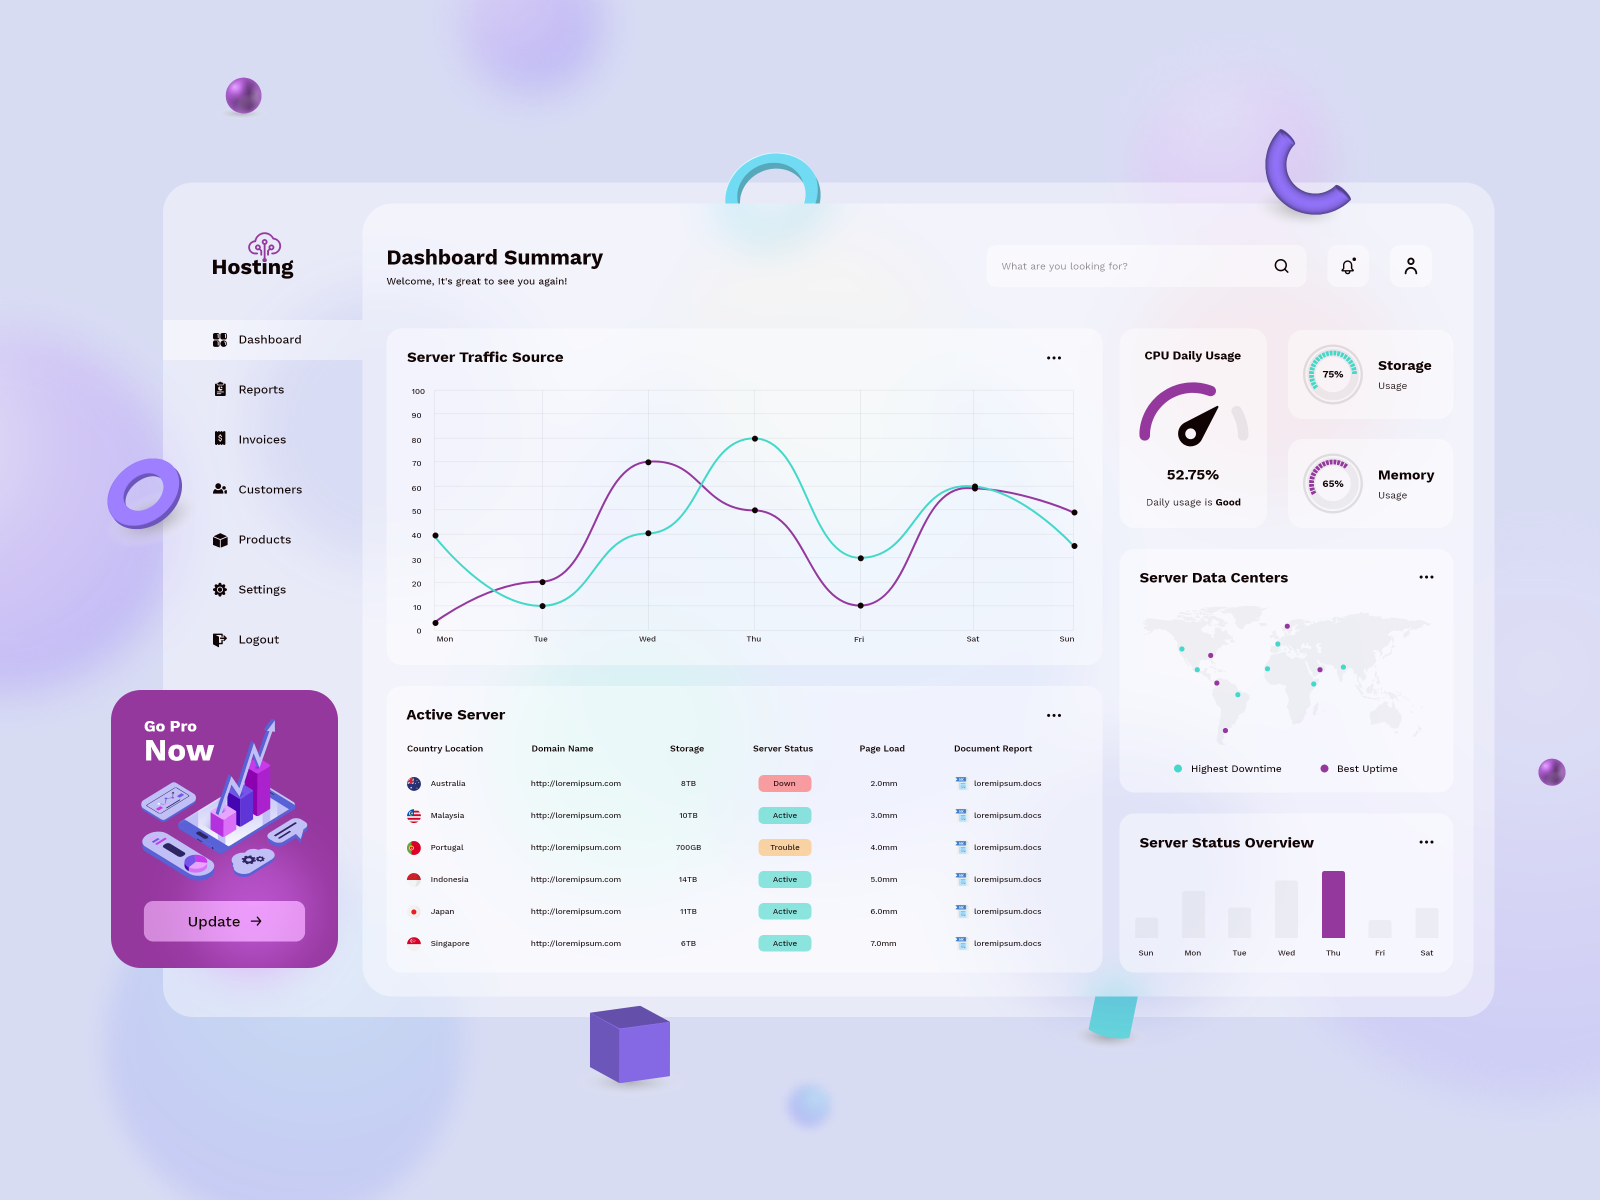
We’re glad to share a stunning Server Monitoring Dashboard that Identifies root causes, immediate issues & monitor server performance.Here we have highlighted important information using graphs and charts that help users process data more quickly. Users can easily click the graphs and line charts to see more information.With the representation of 3D elements and smooth glass effect makes this dashboard design more interactive.Let us know your views in the comment section!Tools: Adobe XDWe’re available for new projects! Drop us a line at [email protected] orhttps://www.cmarix.com/inquiry.html#utm_source=Uplabs

Download now to enhance your projects with visually stunning and user-friendly designs. With FigmaResource.com, you can save time, boost your productivity, and achieve professional-grade results without breaking the bank. Start exploring our vast collection today and take your design projects to the next level!

Discover an extensive library of free, high-quality design assets at FigmaResource.com, your go-to destination for all things Figma. Whether you’re a professional designer or just starting out, our platform offers a wide range of resources, including UI kits, icons, templates, and more, all meticulously crafted to help you streamline your design workflow.

At FigmaResource.com, we understand the importance of having the right tools at your fingertips, which is why we provide these assets completely free of charge. 

Please be aware that while you can download free resources from our website, we do not host any of the files directly. All resources are handpicked and collected from various external sources.